Market Pulse
U.S. crude oil inventories increased by 900,000 barrels during the week ending September 25, according to data released Wednesday by the U.S. Energy Information Administration (EIA). Commercial crude inventories rose to 427.3 million barrels, approximately 2% above the five-year average for this time of year.
The increase followed American Petroleum Institute (API) data released Tuesday, which showed a 1.019-million-barrel rise in crude inventories.
Crude futures were trading higher at 10:22 a.m. in New York. Brent crude was up $0.75, or 0.73%, at $103.34 per barrel, roughly $2 higher than the same time last week. WTI rose $1.38, or 1.54%, to $90.76 per barrel, though it remained approximately $1.25 below last week’s level.
Gasoline inventories declined by 1.7 million barrels, matching the previous week’s draw, while average daily gasoline production was 9.5 million barrels. Middle distillate inventories fell by 2.3 million barrels, with production averaging 5.0 million barrels per day. Distillate inventories are now 14% below the five-year average.
Total products supplied, a proxy for U.S. petroleum demand, averaged 20.8 million barrels per day over the past four weeks, up 2.1% year over year. Gasoline demand averaged 8.7 million barrels per day, while distillate products supplied averaged 3.8 million barrels per day, up 5.2% from the same period last year.
Fundamentals
EIA’s Weekly Petroleum Inventory in MM’s BBLS
| Commodity | US Inventory | Change | 5 Yr Ave | CURRENT MARKETS |
|---|---|---|---|---|
| Crude Oil | 427.3 | 0.9 | 418 | WTI Crude: 1.98 |
| Gasoline | 204.3 | -1.7 | 218 | RBOB: 0.1871 |
| Distallates | 105.1 | -2.3 | 122 | Heating Oil: 0.1105 |
| Commodity | US Inventory | Change | Midwest Invent | Change |
|---|---|---|---|---|
| Propane | 109.6 | 1.8 | 25.6 | -0.5 |
Propane
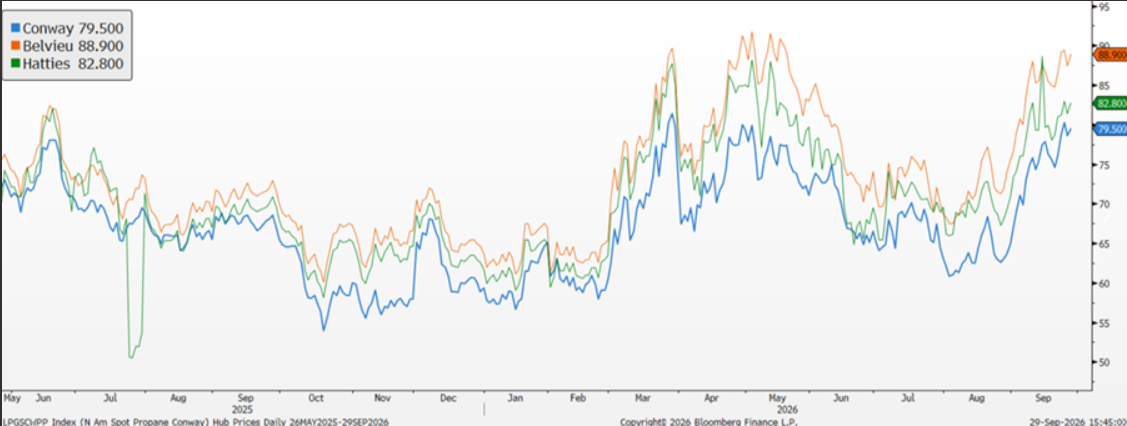
Propane prices moved lower Friday but finished the week higher at Conway, Belvieu, and Hattiesburg. Market volatility increased this week, with hubs moving in different directions.
Harvest began ahead of schedule but has since slowed significantly due to heavy rainfall, increasing reliance on dryers across the Midwest and providing short-term support for Conway spot prices.
Export demand remains firm despite higher shipping costs. Physical demand continues to be supported by increased purchases from China, India, and other Asian buyers, as supply through the Strait of Hormuz remains limited.
Laurel Pipeline Reversal Could Reshape Group 3 Product Flows
The restart of eastbound refined-product movements on the Laurel Pipeline is set to introduce a new dynamic into the Midwest and East Coast fuel markets. While Laurel does not directly connect with the Group 3 market, its ability to move Chicago-area refined products east toward Pennsylvania and New York could have a meaningful impact on the relative value of Chicago, Group 3 and East Coast barrels.
Buckeye Partners’ expanded Laurel service provides additional eastbound refined-product transportation capacity, with the new service capable of moving as much as 80,000 barrels per day. The project moved from a proposed concept to an operational market factor when CITGO announced plans to move gasoline from its Lemont, Illinois refinery to New York in early October. That shipment is expected to be the first movement under the newly reversed Laurel service and provides an early indication that the Chicago-to-East Coast route is becoming commercially viable.
The significance for the Midwest is straightforward. Chicago refiners have historically had to balance production against local demand and the economics of existing outlets. Laurel now provides another destination for those barrels. If Chicago-area refiners find it economical to move gasoline or diesel east through Laurel, product that otherwise would have remained in the Midwest can be pulled out of the Chicago balance. All else equal, that should reduce the amount of surplus product available in Chicago and could provide support to Chicago basis.
The impact on Group 3 is less direct but potentially important. Group 3 is not physically supplied by Laurel, but its barrels can compete with Midwest barrels for access to eastern markets. If Chicago product can move economically through Laurel into Pennsylvania and New York, the Northeast gains another source of supply. That could reduce the need for barrels coming from other supply chains, including barrels whose economics are linked to Group 3.
This creates an interesting dynamic between Chicago and Group 3. Eastbound Laurel movements could tighten Chicago by pulling barrels out of the Midwest, while at the same time increasing product availability in the Northeast. As a result, Chicago could strengthen relative to Group 3 even as additional Midwest supply puts pressure on the price of product in the East Coast market. The key question for Group 3 is therefore less about the outright price of the market and more about how Group 3 trades relative to Chicago and New York Harbor.
Gasoline is likely to provide the first clear indication of how significant the new route will be. CITGO’s announced Lemont-to-New York movement is gasoline, so the initial market response should be visible in gasoline spreads. If the economics are attractive enough to keep Chicago barrels moving east, Chicago gasoline could become tighter while the additional supply reaching the Northeast could reduce the premium available to alternative sources of East Coast product. That could show up as a widening Chicago-versus-Group 3 differential and a narrowing of the premium between Group 3 and New York Harbor.
Diesel could follow a similar pattern, although the response may be different because diesel balances, inventories and seasonal demand are not identical to gasoline. The important relationships to monitor will be Chicago ULSD versus Group 3 ULSD and Group 3 versus New York Harbor. If Laurel begins moving meaningful diesel volumes, those spreads should provide a clearer indication of whether the new pipeline route is materially changing regional balances.
The biggest variable will be actual utilization. An 80,000-barrel-per-day capacity does not mean that 80,000 barrels per day will immediately move east. The pipeline will only run at economically attractive levels when the value of product in Pennsylvania and New York is sufficient to cover the cost of moving it from Chicago. Transportation costs, product specifications, inventories and refinery operating rates will all determine whether the new route becomes a consistent outlet or remains an occasional arbitrage opportunity.
For Group 3, that makes the Chicago-to-Group 3 relationship one of the most important spreads to watch as Laurel ramps up. If Chicago strengthens while Group 3 does not, particularly at the same time that Laurel is moving meaningful volumes east, it would suggest that the new outlet is tightening the Chicago balance and changing the competitive position of Group 3 barrels. Conversely, if Laurel movements remain limited and the Chicago market shows little response, the impact on Group 3 is likely to remain relatively modest.
Ultimately, Laurel should be viewed less as a direct Group 3 competitor and more as a new piece of the Midwest-to-East Coast arbitrage network. Its importance will come from changing the destination options available to Chicago barrels. The more consistently those barrels can move east, the more likely it is that regional pricing relationships will adjust. For market participants watching Group 3, the most useful indicators will therefore be actual Laurel utilization and the relative movement of Chicago, Group 3 and New York Harbor prices rather than any single outright price.
The key question as the first shipments begin is not simply whether Laurel can move product east. It is whether the economics are strong enough to make that route a sustained outlet for Midwest production. If they are, the resulting shift in product flows could become an important factor in the Chicago–Group 3 relationship.
Humor

Disclaimer: The data, information and related graphics (collectively, “Information”) is for general information use only and is compiled from sources believed to be reliable. Dale Petroleum Company does not guarantee its accuracy or completeness, nor does DPC assume any liability for any inaccurate or incomplete information. The Information is not intended to be a research report nor an analysis of a company and it should not be relied upon for making investment decisions. The information is subject to change without notice, is for general information only and is not intended as any offer or solicitation with respect to the purchase or sale of any financial instrument or as personal investment advice.