Market Pulse
Crude inventories showed a mixed picture: a 2.2 million barrel draw was entirely driven by the Strategic Petroleum Reserve (SPR), while commercial stocks increased by 1.9 million barrels. Exports eased slightly but are expected to remain strong in the coming weeks.
Product markets were firm. Gasoline inventories fell by 4.6 million barrels on strong demand, while distillates dropped 3.4 million barrels amid solid demand and exports. Propane stocks rose by 2.1 million barrels as seasonal demand softened, with exports returning to near capacity.
According to the U.S. Energy Information Administration (EIA), commercial crude inventories rose to 465.7 million barrels (about 3% above the five-year average), contrasting with a reported draw from the American Petroleum Institute (API).
Crude prices increased on the day, with Brent at $99.90 and WTI at $90.99.
Overall U.S. petroleum demand remains healthy, averaging 20.5 million barrels per day over the past four weeks, up 3% year over year.
Fundamentals
EIA’s Weekly Petroleum Inventory in MM’s BBLS
| Commodity | US Inventory | Change | 5 Yr Ave | CURRENT MARKETS |
|---|---|---|---|---|
| Crude Oil | 465.7 | 1.9 | 455 | WTI Crude: 3.48 |
| Gasoline | 228.4 | -4.6 | 237 | Heating Oil: 0.1836 |
| Distallates | 108.1 | -3.4 | 121 | RBOB: 0.1320 |
| Commodity | US Inventory | Change | Midwest Invent | Change |
|---|---|---|---|---|
| Propane | 80.0 | 2.1 | 15.0 | 0.3 |
Propane
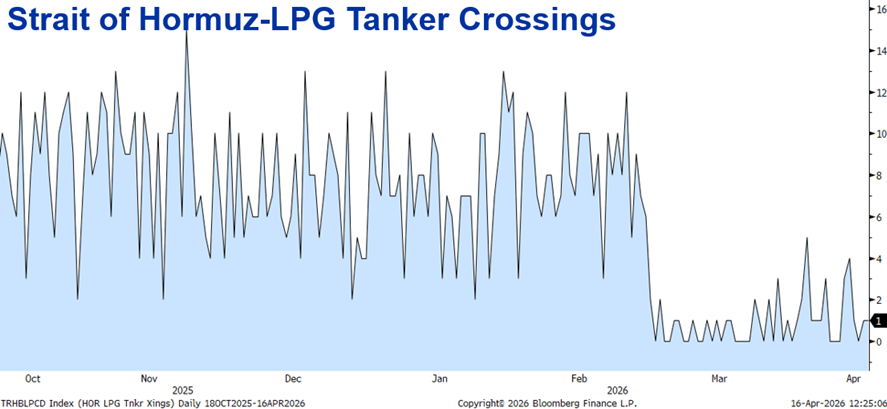
Propane prices did not follow the upward trend observed across broader energy markets. As a result, propane’s percentage relative to WTI declined by more than 4%. Inventory builds have slowed, primarily due to increased export activity. However, the potential for price increases remains, driven by strong demand in Asia. Additionally, there continues to be little to no LPG carrier traffic transiting the Strait of Hormuz.
Lost Barrels
The ongoing conflict in the Middle East has disrupted approximately 500 million barrels of oil supply—valued at roughly $50 billion at an average price of $100 per barrel. The primary driver of these losses has been the severe restriction of traffic through the Strait of Hormuz, a critical transit route that previously handled around 20 million barrels per day.
Seven weeks into the conflict, global oil markets are experiencing significant strain. Regional production has declined sharply, with average output falling by an estimated 9–10 million barrels per day in March compared to pre-conflict levels. This drop has been compounded by infrastructure damage and reduced refinery operations across key producing nations.
Cumulative supply losses reached 430 million barrels by April 10 and have since risen to 500 million barrels. This volume is equivalent to nearly one month of U.S. oil consumption or more than a month of total European demand, underscoring the scale of the disruption.
Even if full transit through the Strait of Hormuz were restored immediately, supply recovery is expected to be gradual. Restarting upstream production and normalizing export flows could take months or longer, leaving oil markets tight and prices under sustained upward pressure.
Funny

Disclaimer: The data, information and related graphics (collectively, “Information”) is for general information use only and is compiled from sources believed to be reliable. Dale Petroleum Company does not guarantee its accuracy or completeness, nor does DPC assume any liability for any inaccurate or incomplete information. The Information is not intended to be a research report nor an analysis of a company and it should not be relied upon for making investment decisions. The information is subject to change without notice, is for general information only and is not intended as any offer or solicitation with respect to the purchase or sale of any financial instrument or as personal investment advice.