Market Pulse
U.S. crude oil inventories rose by 5.5 million barrels for the week ending March 27, according to the U.S. Energy Information Administration (EIA), bringing commercial stockpiles to 461.6 million barrels, slightly above the five-year seasonal average and exceeding expectations for a 414,000-barrel build. This follows an earlier report from the American Petroleum Institute indicating a larger increase of 10.263 million barrels. Crude prices declined in Wednesday morning trading amid the EIA release and remarks from President Donald Trump suggesting a potential near-term end to the war, with Brent crude at $101.70 per barrel (down 2.17% on the day) and WTI at $99.31 per barrel (down 2.04%). In refined products, gasoline inventories fell by 600,000 barrels as production averaged 9.6 million barrels per day, while distillate stocks declined by 2.1 million barrels with production steady at 5.0 million barrels per day. Total U.S. petroleum demand remained strong, averaging 20.9 million barrels per day over the past four weeks, up 4.2% year over year, with gasoline demand at 8.9 million barrels per day and distillate demand rising 5.6% to 4.0 million barrels per day. In propane markets, inventories increased by 4.1 million barrels to 77 million barrels, significantly above expectations, with exports rising by 27,000 barrels per day to 1.899 million bpd and total inventories now 32.9 million barrels higher than a year ago, representing a 74.5% year-over-year increase; regionally, Gulf Coast (PADD 3) inventories rose by 3.6 million barrels, Midwest (PADD 2) by 100,000 barrels, East Coast (PADD 1) by 300,000 barrels, and PADDs 4 and 5 by a combined 100,000 barrels. Conway prices declined by $0.0175 and Belvieu by $0.0075 following the EIA report.
Fundamentals
EIA’s Weekly Petroleum Inventory in MM’s BBLS
| Commodity | US Inventory | Change | 3 Yr Ave | CURRENT MARKETS |
|---|---|---|---|---|
| Crude Oil | 461.6 | 5.5 | 454 | WTI Crude: -2.40 |
| Gasoline | 240.9 | -0.6 | 234 | Heating Oil: -0.1132 |
| Distallates | 117.8 | -2.1 | 112 | RBOB: -0.1097 |
| Commodity | US Inventory | Change | Midwest Invent | Change |
|---|---|---|---|---|
| Propane | 77.0 | 4.1 | 14.6 | 0.1 |
Propane
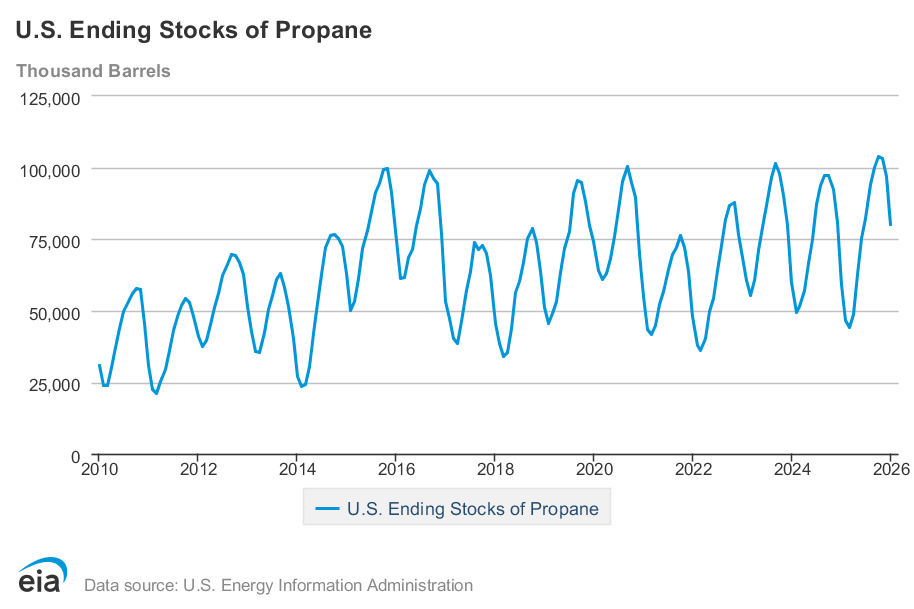
Propane prices diverged from crude oil on the final day of March, with the decline likely driven by end-of-month selling pressure among traders, as WTI crude posted only modest losses. Mt. Belvieu led the downturn, falling 8.25 cents per gallon and widening the Asian export arbitrage.
A survey of industry participants indicates expectations for a 414,000-barrel increase in U.S. propane inventories in this morning’s EIA report. Although a slight uptick in U.S. propane exports is anticipated, reduced heating demand across much of the country, combined with higher production levels, has led to forecasts of a modest inventory build. By comparison, over the past five years, U.S. propane inventories have declined by an average of 680,000 barrels during the fourth week of March. Regardless, the U.S. propane market remains oversupplied, particularly along the Gulf Coast.
Iran War
Signs of progress toward ending the conflict remain limited and cautious. U.S. officials indicate that some objectives, such as weakening Iran’s military capabilities, have been partially achieved, and there are hints that the U.S. may scale back involvement in the coming weeks. However, a formal ceasefire or peace agreement has not been established, and Iran continues to maintain a defiant stance, particularly regarding its nuclear program and regional influence. Political and public pressure is also shaping the conflict’s trajectory: in the U.S., only a small fraction of the population supports sending troops, and global allies remain hesitant to intervene militarily. At the same time, economic pressures, including rising energy prices and financial stability concerns are mounting internationally. Overall, while Iran’s military appears partially degraded and there is occasional market optimism over potential de-escalation, the war remains active and fragile, with the risk of escalation, especially through critical oil routes and regional proxy activity, still very high.
Funny

Disclaimer: The data, information and related graphics (collectively, “Information”) is for general information use only and is compiled from sources believed to be reliable. Dale Petroleum Company does not guarantee its accuracy or completeness, nor does DPC assume any liability for any inaccurate or incomplete information. The Information is not intended to be a research report nor an analysis of a company and it should not be relied upon for making investment decisions. The information is subject to change without notice, is for general information only and is not intended as any offer or solicitation with respect to the purchase or sale of any financial instrument or as personal investment advice.